Perhaps forgotten amidst the breathless coverage of Elon Musk’s unilateral, unchecked gutting of the federal government is that his businesses appear to be floundering. But, Musk considers himself a businessman first and foremost. The firms he oversees — like Tesla — give him billions of dollars in compensation to serve as CEO.
However it doesn’t seem like Musk is devoting the time necessary to properly manage multiple multi-billion dollar companies. I’ve repeatedly shown that Elon Musk spends too much time on Twitter — tweeting upwards of 100 times a day. Between his Twitter habits and new governmental responsibilities, it’s hard to believe Musk has the time to serve as CEO of massive companies like Tesla and SpaceX. And the market seems to agree. As of March 11th, Tesla stock is down a whopping 45.6% since the inauguration.
Of course, we can’t simply conclude that this indicates a Tesla-specific stock crash. The market has been in flux since Trump took office. Maybe the EV market took a hit amidst the administration’s emphasis on fossil fuels. We need more information before we can make any conclusions.
Luckily, I have experience with just this sort of thing. In another life, I worked at a company where I used econometrics to analyze abnormal stock returns for court cases. In other words, we can use a proven statistical technique to assess if Tesla’s post-inauguration slump is statistically significant.
Without further ado, let’s get started. Click to jump ahead:
Tesla since the inauguration
First, let’s look at how Tesla stock has performed since Trump’s inauguration. We compare this performance to the S&P 500 (Market) and a number of Tesla competitors (Peers). In order to make this chart easier to read, we “peg” returns to an index of 100 starting on 1/21/25. You can think of each line as showing how you would be doing if you invested $100 at the beginning of the period.

Since the inauguration, the Market and Tesla Peers have largely held steady. If you invested $100 in either at the start, you’d have anywhere from $92.21 to $106.17 by March 11th. But if you invested in Tesla, you’d have just $54.37. That’s a difference worth over 100 Chicken McNuggets.
Tesla since Election Day
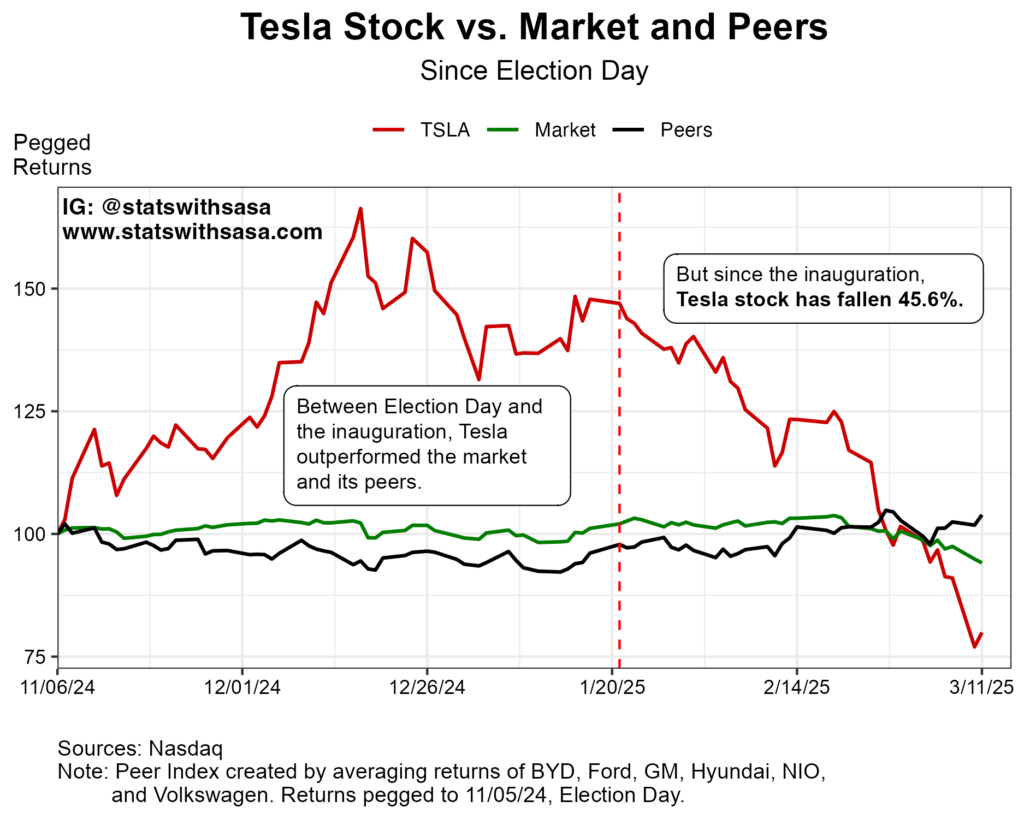
But let’s zoom out. Before the inauguration, Tesla stock was surging, likely thanks to market belief that Elon Musk’s closeness to Trump would result in significant tax breaks and new government contracts. This time we start our “peg” on 11/6/24, the day after the election (since results were called after market close).

In some ways, this chart is even more stark than the last. Despite Tesla’s insane growth between Trump’s election and subsequent inauguration — TSLA was up 47.8% in that time — the stock is still down overall.
Event Study Analysis
Okay, so visually we have shown that Tesla has underperformed the market and its peers since the Trump inauguration, when Elon assumed his political role. But is this difference statistically significant, or just noise?
Enter the Event Study, a tried-and-true econometric method for assessing irregular stock returns. Commonly used in litigation, this method essentially assesses if a stock is moving “abnormally” in response to news — in this case, Musk’s recent antics. In other words, we can leverage this method to assess if Tesla’s post-inauguration slump is statistically significant, when compared to the market and its peers. For more on my methodology, click here.
The following chart summarizes the results of my Event Study analysis. It shows the cumulative abnormal returns for Tesla since Trump’s inauguration. These are the “abnormal” returns beyond what we would expect when controlling for the market and peers. We would expect that cumulative abnormal returns would hover around 0% if Tesla was acting in line with the market and its peers. A high positive cumulative abnormal return would suggest that Tesla is performing better than expected. A negative cumulative abnormal return would suggest the opposite.
 The chart is clear:
Since Trump’s inauguration, Tesla is underperforming the market and its peers. This underperformance is statistically significant at the 0.01 level.
Conclusion
We’ve shown that Tesla’s post-inauguration slump is statistically significant. But statistics can only tell us so much — it can’t say why the stock is crashing. It could be that the market thinks that Elon Musk is no longer paying attention to Tesla in favor of DOGE. It could be that the market thinks Elon Musk’s antics have alienated Tesla from large swathes of potential customers. Just recently, there were large protests of Tesla, which accompanied a 15.4% stock price drop. The truth is probably some mixture of both.
Thanks for reading! If you enjoyed this article, please consider subscribing below.
