The 2024 Presidential Election is shaping up to be historical for all the wrong reasons. Joe Biden and Donald Trump, the two presumptive nominees, are historically unpopular. They’re the oldest candidates in US History (shattering a record set four years ago by… the same two guys). There’s a nonzero chance that Trump goes to jail during the race. The list goes on.
As the current incumbent president, Biden faces a lot of pressure, and this article focuses on him. At the time of this article, his approval rating stands at a stark -18.2% according to 538. Dissatisfied with his age, a cost-of-living crisis, and his response to the ongoing conflict in Gaza, many Democrats do not want Biden as their candidate. Some polls put that number at as much as 50%.
Faced with no serious Democratic alternatives to Biden, many Democrats feel stuck between a rock and a hard place. Nonetheless, dissatisfied Democrats have mounted a relatively successful “Vote Uncommitted” campaign during the primaries to voice their satisfaction with the sitting President. Originally a protest vote in Michigan to condemn Biden’s indifference to suffering in Gaza (and continued arming of Israel), the movement spread during this week’s Super Tuesday. In Michigan, over 100,000 (13%) votes went Uncommitted. On Super Tuesday, nearly 19% of voters in Minnesota and over 12.5% of voters in North Carolina also voiced their displeasure through Uncommitted votes.
In response to Biden’s apparent primary struggles, pundits across the political spectrum have declared him dead in the water. But as some have (rightly) pointed out, Biden isn’t the first modern incumbent president to face a serious primary “protest vote”. For instance, a whopping 42.2% of voters voted Uncommitted in the 2012 Kentucky primary against Obama.
So, let’s take a look at how Biden’s primary performances thus far have stacked up against previous incumbent presidents. For this analysis, I used FEC data on primary elections dating back to 1992. In this period, there were six incumbent presidents: George H.W. Bush, Bill Clinton, George W. Bush, Barack Obama, Donald Trump, and Joe Biden. If we omit races where the incumbent ran unopposed (such as Georgia in 2020), roughly 161 primary races remain, which gives us a respectable sample size to work with.
This article is a long one, so click below to skip ahead:
The Uncommitted Campaign
To start, let’s evaluate how 2024’s Uncommitted protest vote compares to past votes. In particular, the Uncommitted vote in Michigan this year sticks out as significant, with over 100,000 total votes. Biden won the state by just 150,000 votes in 2020, so if roughly half those Uncommitted voters voted for Trump and the rest stayed home on Election Day, the state would flip. Let’s see how this raw vote total stacks up to past Uncommitted vote campaigns:
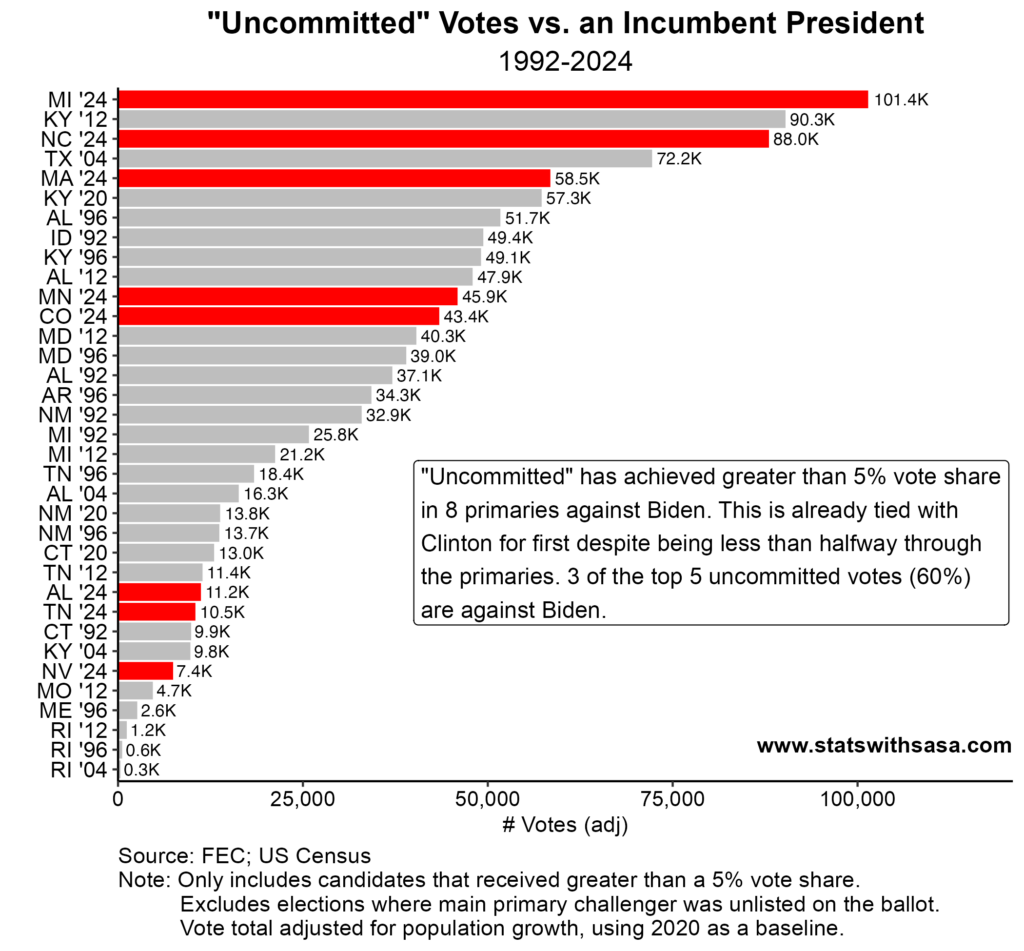
Before you say anything: I adjusted this chart for change in population by state since 1992. Here, we see that there is some truth to claims that the Uncommitted campaign against Biden has been historic. The Uncommitted vote share against Biden has surpassed 5% eight times already. This already ties for first amongst incumbent presidents in the data, despite the primaries being less than halfway over. Moreover, 3 of the top 5 Uncommitted vote totals since 1992 have been against Biden this year.
However, vote totals can only tell us so much. After all, ten thousand votes in California differ in impact from ten thousand votes in Rhode Island. So let’s look at vote share of Uncommitted against incumbents:
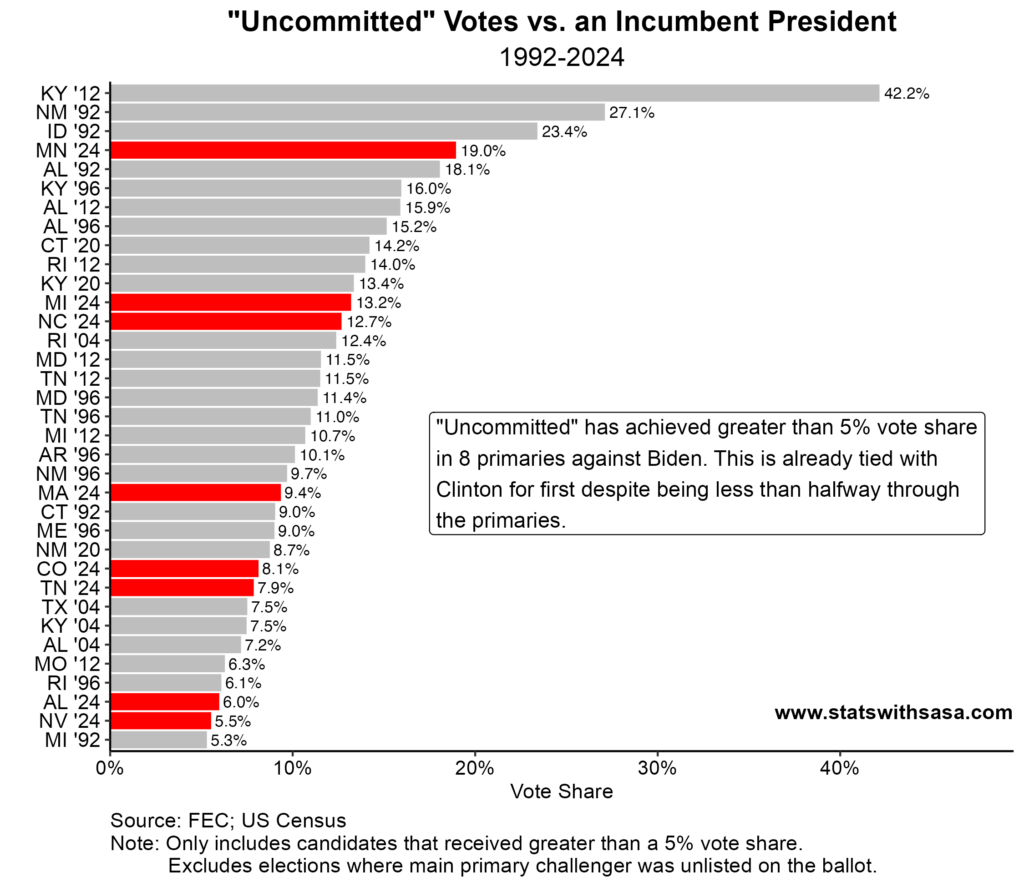
This chart paints a murkier picture. Although Biden is still arguably overrepresented, we see some past contests having a much larger Uncommitted vote by percentage. Overall:
There is mixed evidence so far to that the Uncommitted campaign against Biden has been truly historic.
Overall Primary Performance
Alright, so we see mixed evidence of Biden stumbling against an Uncommitted campaign so far. But Uncommitted votes are just a part of the picture. Let’s set that aside and look at the big picture: how has each incumbent president performed in the primaries overall since 1992?
For this component of the analysis, I look at overall vote share of each incumbent president in their respective primary campaign. In other words, I sum the total votes for the incumbent across all primaries and divide by all votes. This essentially weights states by population, and (I believe) does a better job of capturing overall popular sentiment towards the incumbent. I also omit races where the incumbent was the only option listed on the ballot, although doing so doesn’t qualitatively change the results. The following chart summarizes this analysis:
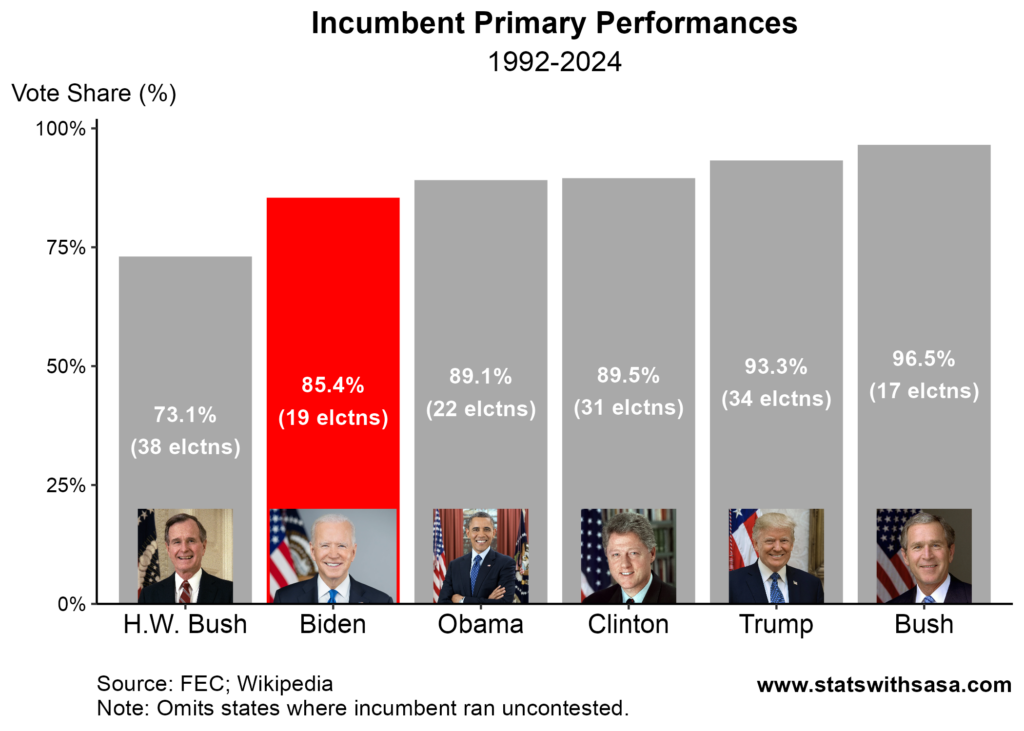
This chart paints a troubling picture for Biden. Aside from George H.W. Bush, who lost his re-election campaign in a 370-168 electoral landslide to Bill Clinton, Biden’s primary performance so far is the worst among incumbent presidents since 1996.
At first glance, this chart might actually not look too bad. After all, Biden’s 85.4% vote share isn’t that far off from that of Obama (89.1%) and Clinton (89.5%), who both comfortably won re-election. Furthermore, Biden won the 2020 popular vote by a comfortable 4.5% margin over Trump. However, these statements obscure the fact that the electoral math is simply not in Biden’s favor this year.
A State Level Look
Biden won Georgia, Arizona, and Wisconsin by less than 1%. In fact, he won Georgia and Arizona by barely 10k votes each. Furthermore, he only won Michigan by 150,000 votes. Remember those 100,000 Michigan Uncommitted votes, largely in protest of Biden’s handling of Gaza? Well, Michigan has disproportionately large Arab and Muslim populations. And those populations are particularly incensed by Biden’s abandonment of Gaza’s civilians. If Trump can flip 3 of these 4 states, he will win the election.
Given this, we might want to look at things at a state level, not overall. I looked at how the incumbent’s general election vote share in each state changed from their initial election to their re-election campaign. I then compared this change in general election vote to the incumbent’s primary performance in each state. The following chart summarizes this analysis:
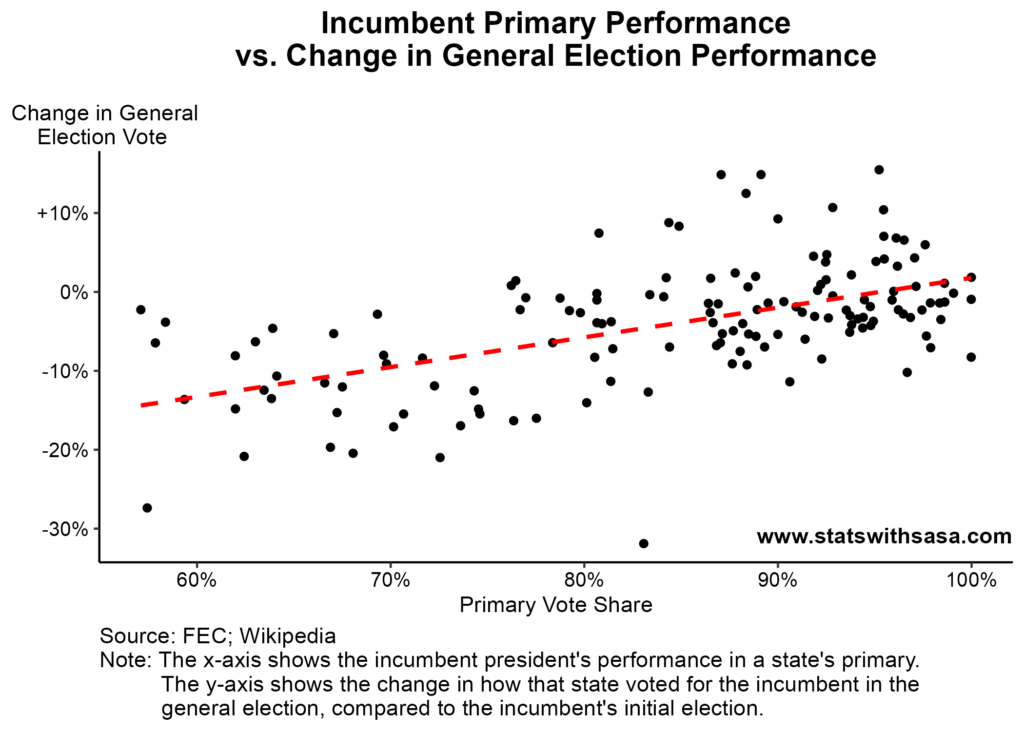
This chart is incredibly damning for Biden. There is a clear, evident relationship between a president’s primary performance and his performance in his re-election campaign. Incumbent presidents tend to do a little worse in the re-election campaigns, but they tend to do less worse in states where they had strong primary performances.
However, this two-dimensional chart may obscure other aspects of the data. Let’s look at how this relationship differs by each president:
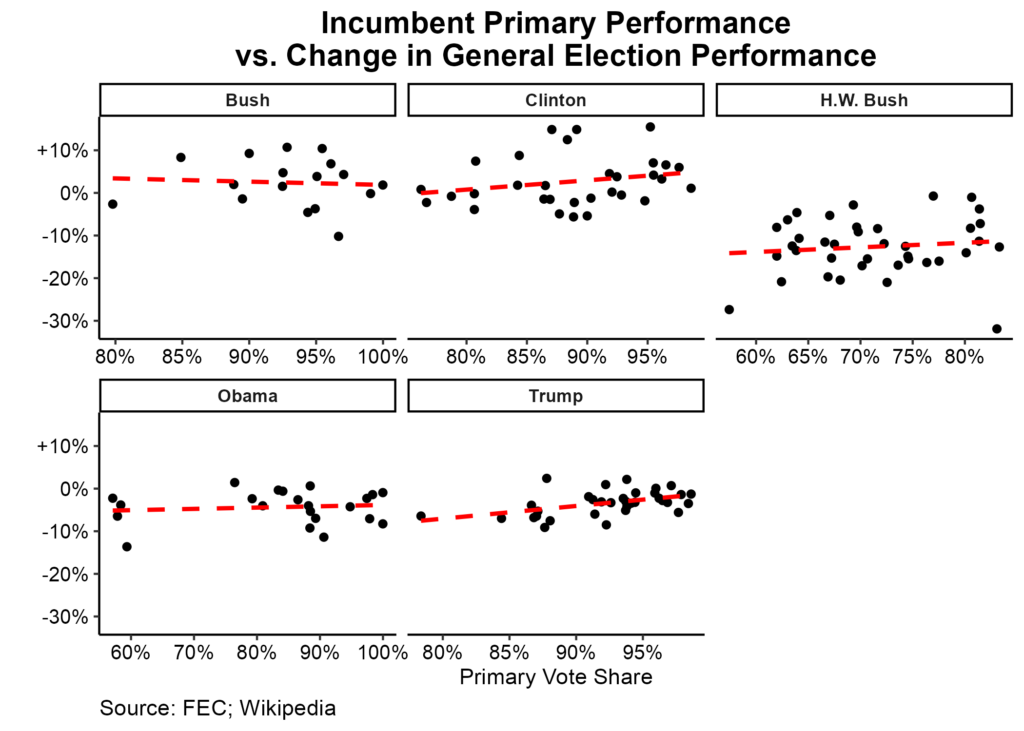
This is admittedly not my prettiest chart, but it gets the point across. We see that the aforementioned trend actually doesn’t apply to all presidents. It seems to hold for Clinton, H.W. Bush, and Trump. Not so much for Obama and George Bush.
Michigan
Of the four arguably most important states to Biden this year, only one has had its primary so far: Michigan. So let’s apply our previous state level analysis to Michigan. We have Michigan primary data for three other incumbents: H.W. Bush, Obama, and Trump. The following chart shows how their primary performances compare to their general election performances:

Again, we see a bleak picture for Biden. Among the incumbents in our data, all of them had a vote share decrease between their initial and re-elections that would lead to Michigan flipping against Biden. Biden had a primary performance in between Bush and Obama, who had corresponding vote share decreases of 15.3% and 7%, respectively. For context, a vote share decrease of greater than 2.8% would swing Michigan to Trump.
The historical relationship between incumbent primary performance and general election performance suggests that Michigan will flip in 2024
I should pause here to note that the above analysis is far from truly “scientific”. I will not make any claims of “statistical significance” or the like. I simply suggest that historical data suggests a relationship between primary performance and general election performance for incumbents. And that relationship forecasts that Biden is in very real danger of losing Michigan. If, like most pundits, you consider Arizona and Georgia foregone conclusions, this indicates an electoral loss for Biden in 2024.
Conclusions
Personally, I believe that Biden is in very real trouble of losing the 2024 election. He enjoyed a +22.6 approval rating when he assumed office. That has since plummeted over forty points to -18.2. Biden is in the midst of multiple crisis, and most Americans disapprove of how he’s handling them. Over 30,000 civilians are dead in Gaza, with no end in sight, and Biden has honestly seemed pretty cavalier about it. Americans are tiring of sending aid to Ukraine while we are stuck in a domestic cost-of-living crisis, where the average American is now rent-burdened. Not to mention Biden is already the oldest president in US history — an issue to most voters.
The evidence largely supports the hunch that Biden is in trouble. The Uncommitted campaign has made itself heard, And if we look at the historical relationship between incumbent primary performance and their performance in the general election, we see a bleak picture for Biden.
That being said, we’re still 8 months out from the actual general election. Biden has a lot of time, and Trump is probably a historically weak opponent. He’s mired in multiple criminal cases. And whatever people say about Biden’s mental clarity, Trump seems to be losing it as well. He’s repeatedly mixed up Biden and Obama Despite the fact that one is a 60 year old Black man who served as President 10 years ago, and the other is an 81 year old White guy. For those of us who want to avoid a Trump presidency, all is not lost.
Thanks for reading this far. To me, this election is kind of depressing stuff. So here’s a fun song. And don’t forget to subscribe below if you want to read more stuff like this.
