Fact or Fiction is a new series where I tackle popular internet narratives and use data analytics to check how true they are.
In the wake of the Supreme Court’s recent ruling on Roe v. Wade, outraged supporters of abortion rights across the U.S. have declared the current Supreme Court bench “illegitimate.” Advocates of this position point out that a number of current justices were appointed by presidents who lost the popular vote. They also stress that many of the court’s recent decisions have been very unpopular among the American public. For example, recent polls suggest that around 59% of Americans disapprove of the court’s ruling on Roe v. Wade. This doesn’t sound like an overwhelming majority, but as a comparison, only 4 of the past 50 presidential elections have been decided by a larger margin. Not even Reagan in 1984 – who won 525 electoral votes – crossed this threshold in the popular vote.
At face value, these arguments make sense. But it’s also important to note that historically, the Supreme Court has been no stranger to controversial and/or unpopular decisions. Some cases that immediately come to mind are Citizens United and Bush v. Gore. Even current day “no-brainers” like Loving v. Virginia (legalizing interracial marriage) and Brown v. Board of Education (ruling segregated schools unconstitutional) were incredibly controversial in their time. In fact, some people might even argue that the Supreme Court should be insulated from public opinion in order to prevent a “tyranny of the majority” from forcing through unconstitutional laws.
Quick Caveat: The “legitimacy” of a public institution is, quite frankly, something I’m not qualified to (or comfortable) opining on. It’s a murky and subjective topic that’s best left up to political scientists. But, as a Data Scientist, I can evaluate the accuracy of claims like “the Supreme Court is historically unrepresentative of the U.S. population.” So that’s what this post is going to focus on.
The Representativeness of the Supreme Court
Popular Vote Losers
One of the central tenants underlying the argument that the Supreme Court is “illegitimate” is the fact that a number of justices were appointed by presidents that lost the popular vote. By extension, many people argue that this makes the Supreme Court unrepresentative of the will of the American voting populace.
President George W. Bush, who lost the 2000 popular vote to Al Gore, appointed Chief Justice John Roberts and Justice Samuel Alito. President Trump, who lost the 2016 popular vote to Hillary Clinton, appointed Justices Neil Gorusch, Brett Kavanaugh, and Amy Coney Barrett. That brings the total to 5 of the 9 (56%) current Supreme Court justices as having been appointed by conservative Presidents who at one point lost the popular vote.
However, this particular issue is probably a little trickier than this simple back-of-the-envelope analysis. For example, the 2 judges appointed by President Bush were appointed in 2005 and 2006, respectively. Although Bush lost the 2000 popular vote, he did win the 2004 popular vote by over 3 million votes. For the purposes of this article, I consider the popular vote margin of the election immediately before the appointment of a particular justice. As a result, that narrows the total to 3 of the 9 (33%) current Supreme Court justices as having been appointed by conservative Presidents who lost the most recent popular vote.
Historical Context
Contrary to popular belief, Bush and Trump are not the only presidents who lost the popular vote. In fact, it’s happened 3 other times in our nation’s history. In 1824, John Quincy Adams assumed the presidency despite losing the popular vote (in fact, he also lost the Electoral College). This happened again in 1876 when Rutherford B. Hayes won the election despite losing the popular vote by a whopping three percentage points. Twelve years later, Benjamin Harrison defeated Grover Cleveland in 1888 even though he received nearly 100,000 fewer votes. These 3 popular vote losers appointed 7 justices between them (1 by J.Q. Adams, 2 by Hayes, and 4 by Benjamin Harrison). In fact, by the time Benjamin Harrison was done appointing justices in 1893, 6 out of 8 (75%) Supreme Court justices were appointed by a president that had lost the most recent popular vote.
Quantifying Representativeness
Ok so the Supreme Court’s makeup hasn’t exactly reflected the will of the voting population several times in the past. To see how the current bench stacks up, we need to think of a way to quantify the “unrepresentativeness” of a Supreme Court bench. There are several approaches that could potentially work.
Approach 1: The Naive Approach
The first thing we might think of doing is to average the popular vote margin of the presidents who appointed each justice on the bench. Presidents that appointed multiple justices would be counted multiple times. A bench with a higher average popular vote margin is arguably more representative because the justices have been appointed by presidents with a greater popular vote mandate.
We can plot the average popular vote margin of historic Supreme Court benches and compare it to the current bench to get an initial idea of how “representative” this current bench is. I consider each unique Supreme Court bench since 1920 for this analysis. 1920 is kind of arbitrarily chosen, but it is important as the first Presidential Election where women had the right to vote. After 1920, we can think of the popular vote as better reflecting the will of Americans in general (rather than just landowning white men). Since 1920, there have been 46 unique Supreme Court benches.
Important note: When I discuss the “current Supreme court bench” in this article, I am referring to the one that most recently ruled on cases. As a result, this includes Clinton appointee Stephen Breyer instead of incoming Biden appointee Ketanji Brown Jackson. This does not make a substantive impact on my analysis because both were appointed by Democrat presidents who won the popular vote. In fact, doing so is actually conservative for this particular approach since Biden won the election by 4.5 percentage points compared to Clinton’s 5.6 point victory.
The results can be seen below in the form of a histogram:
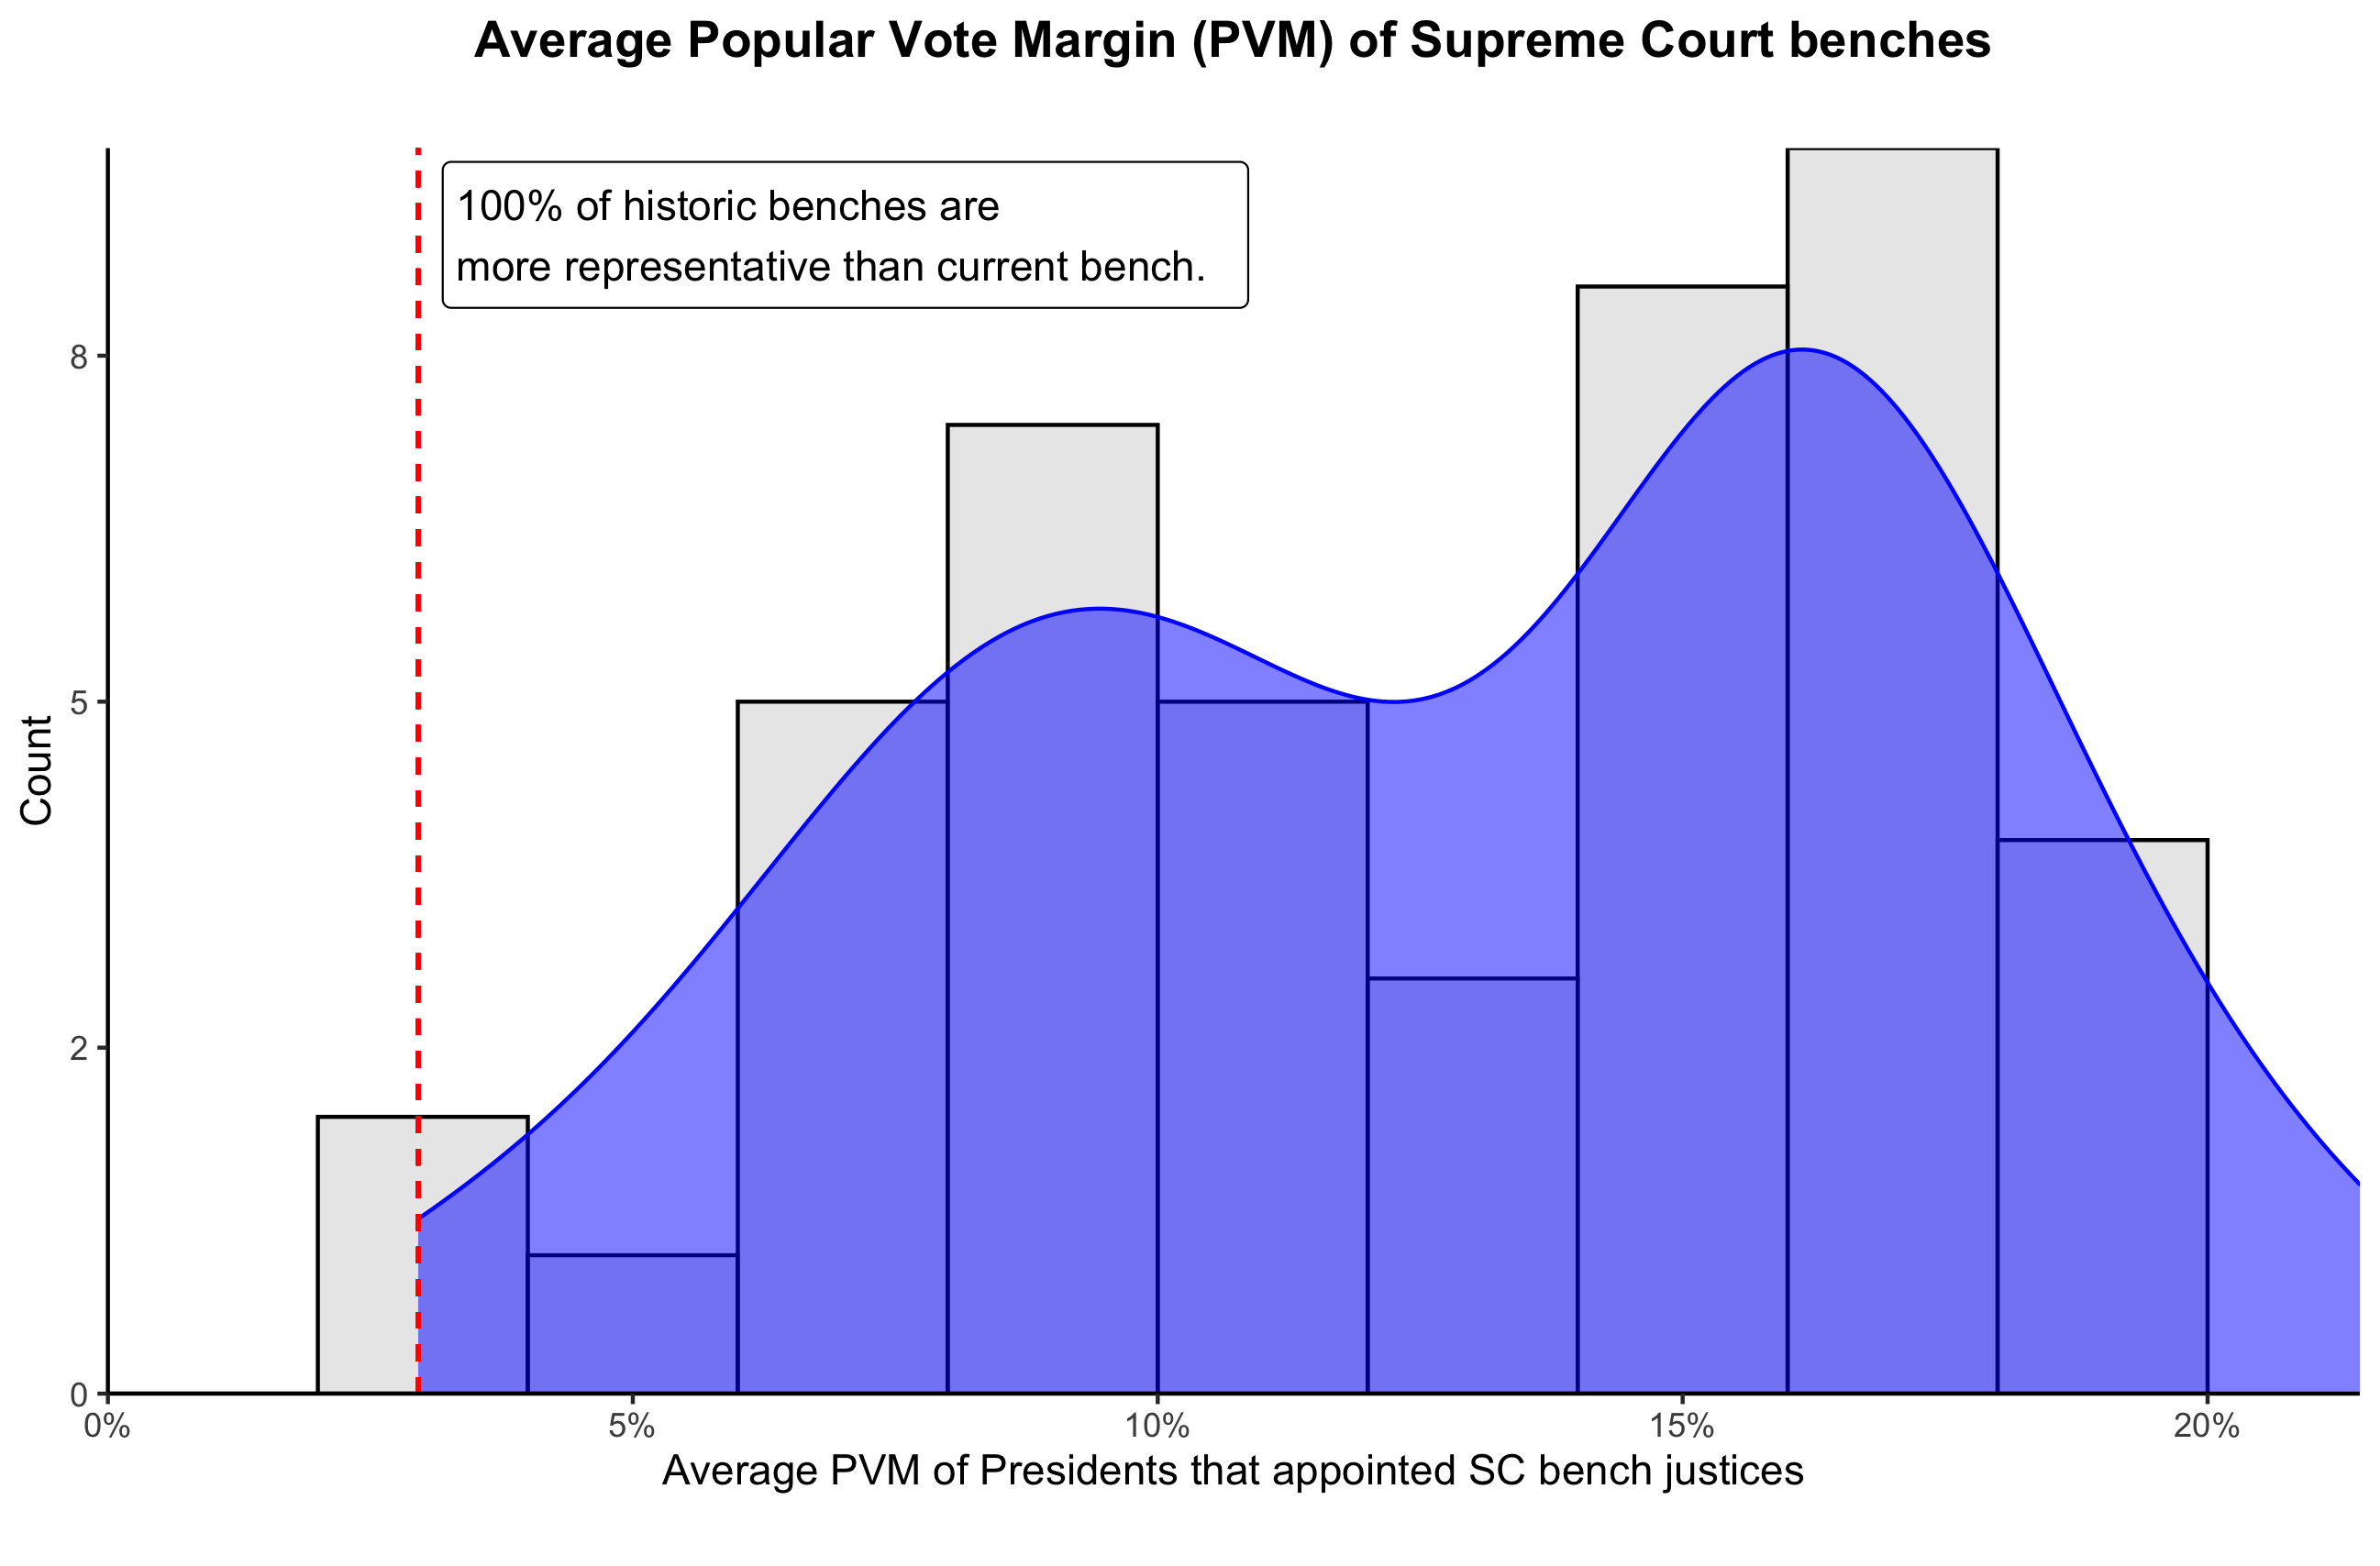
The results of this initial look are stark. The average popular vote margin of the presidents that appointed the current Supreme Court bench is just 2.96%. Every single historical Supreme Court bench since 1920 had a larger average popular vote margin than the current Supreme Court bench. In other words, the presidents who appointed the current Supreme Court bench had the smallest “popular vote mandate” than every single other Supreme Court bench since 1920.
However, we can think of a big con to this naive approach:
- This does not account for the fact that different eras of American history have differed in how close their presidential elections are. For example, from 1880–1900 the average popular vote margin was 2.42% – compared to 1920–1940 when the average popular vote margin was 20.1%. Does that automatically make a Supreme Court bench from the 1930s “more representative” than one from the 1890s? Probably not.
So let’s keep trying.
Approach 2: Taking into account Historical Context
As I mentioned above, the first approach doesn’t really do a good job of accounting for historical context. What if we took into account how close the average presidential election was during the appointing of each Supreme Court bench? This approach is best explained using an illustrative example:
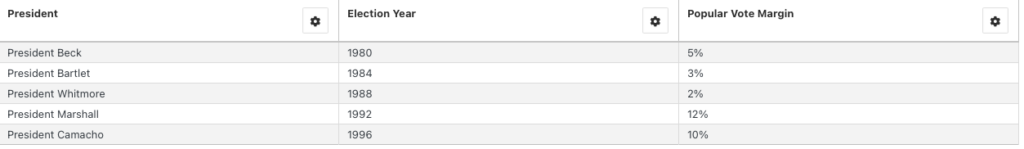
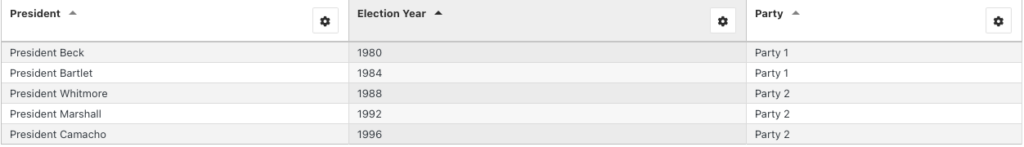
- Consider that we have a hypothetical Supreme Court bench in 1996 with 4 justices appointed like below:

- Using Approach 1, the average popular vote margin of this bench is 4.8% (the average of 5%, 2%, 2%, and 10%). However, now consider that during this time period, the presidential election results were as follows:
- Here we see that since the oldest tenured judge (Judge A) was appointed, there were 5 elections of 5 presidents – even though only 3 of them actually appointed justices. The average popular vote margin of these 5 presidential elections is 6.4%. This suggests that the average popular vote margin of the appointing presidents (4.8%) is 29.6% less than the equally weighted average popular vote margin of all presidents in the time period.
Here we see that the presidents who appointed this hypothetical Supreme Court bench had popular vote margins that were about 30% lower than the average presidential election in that time period. This suggests an “unrepresentative” Supreme Court. We can repeat this calculation for each Supreme Court bench in history. Below is a chart summarizing the results of this exercise:
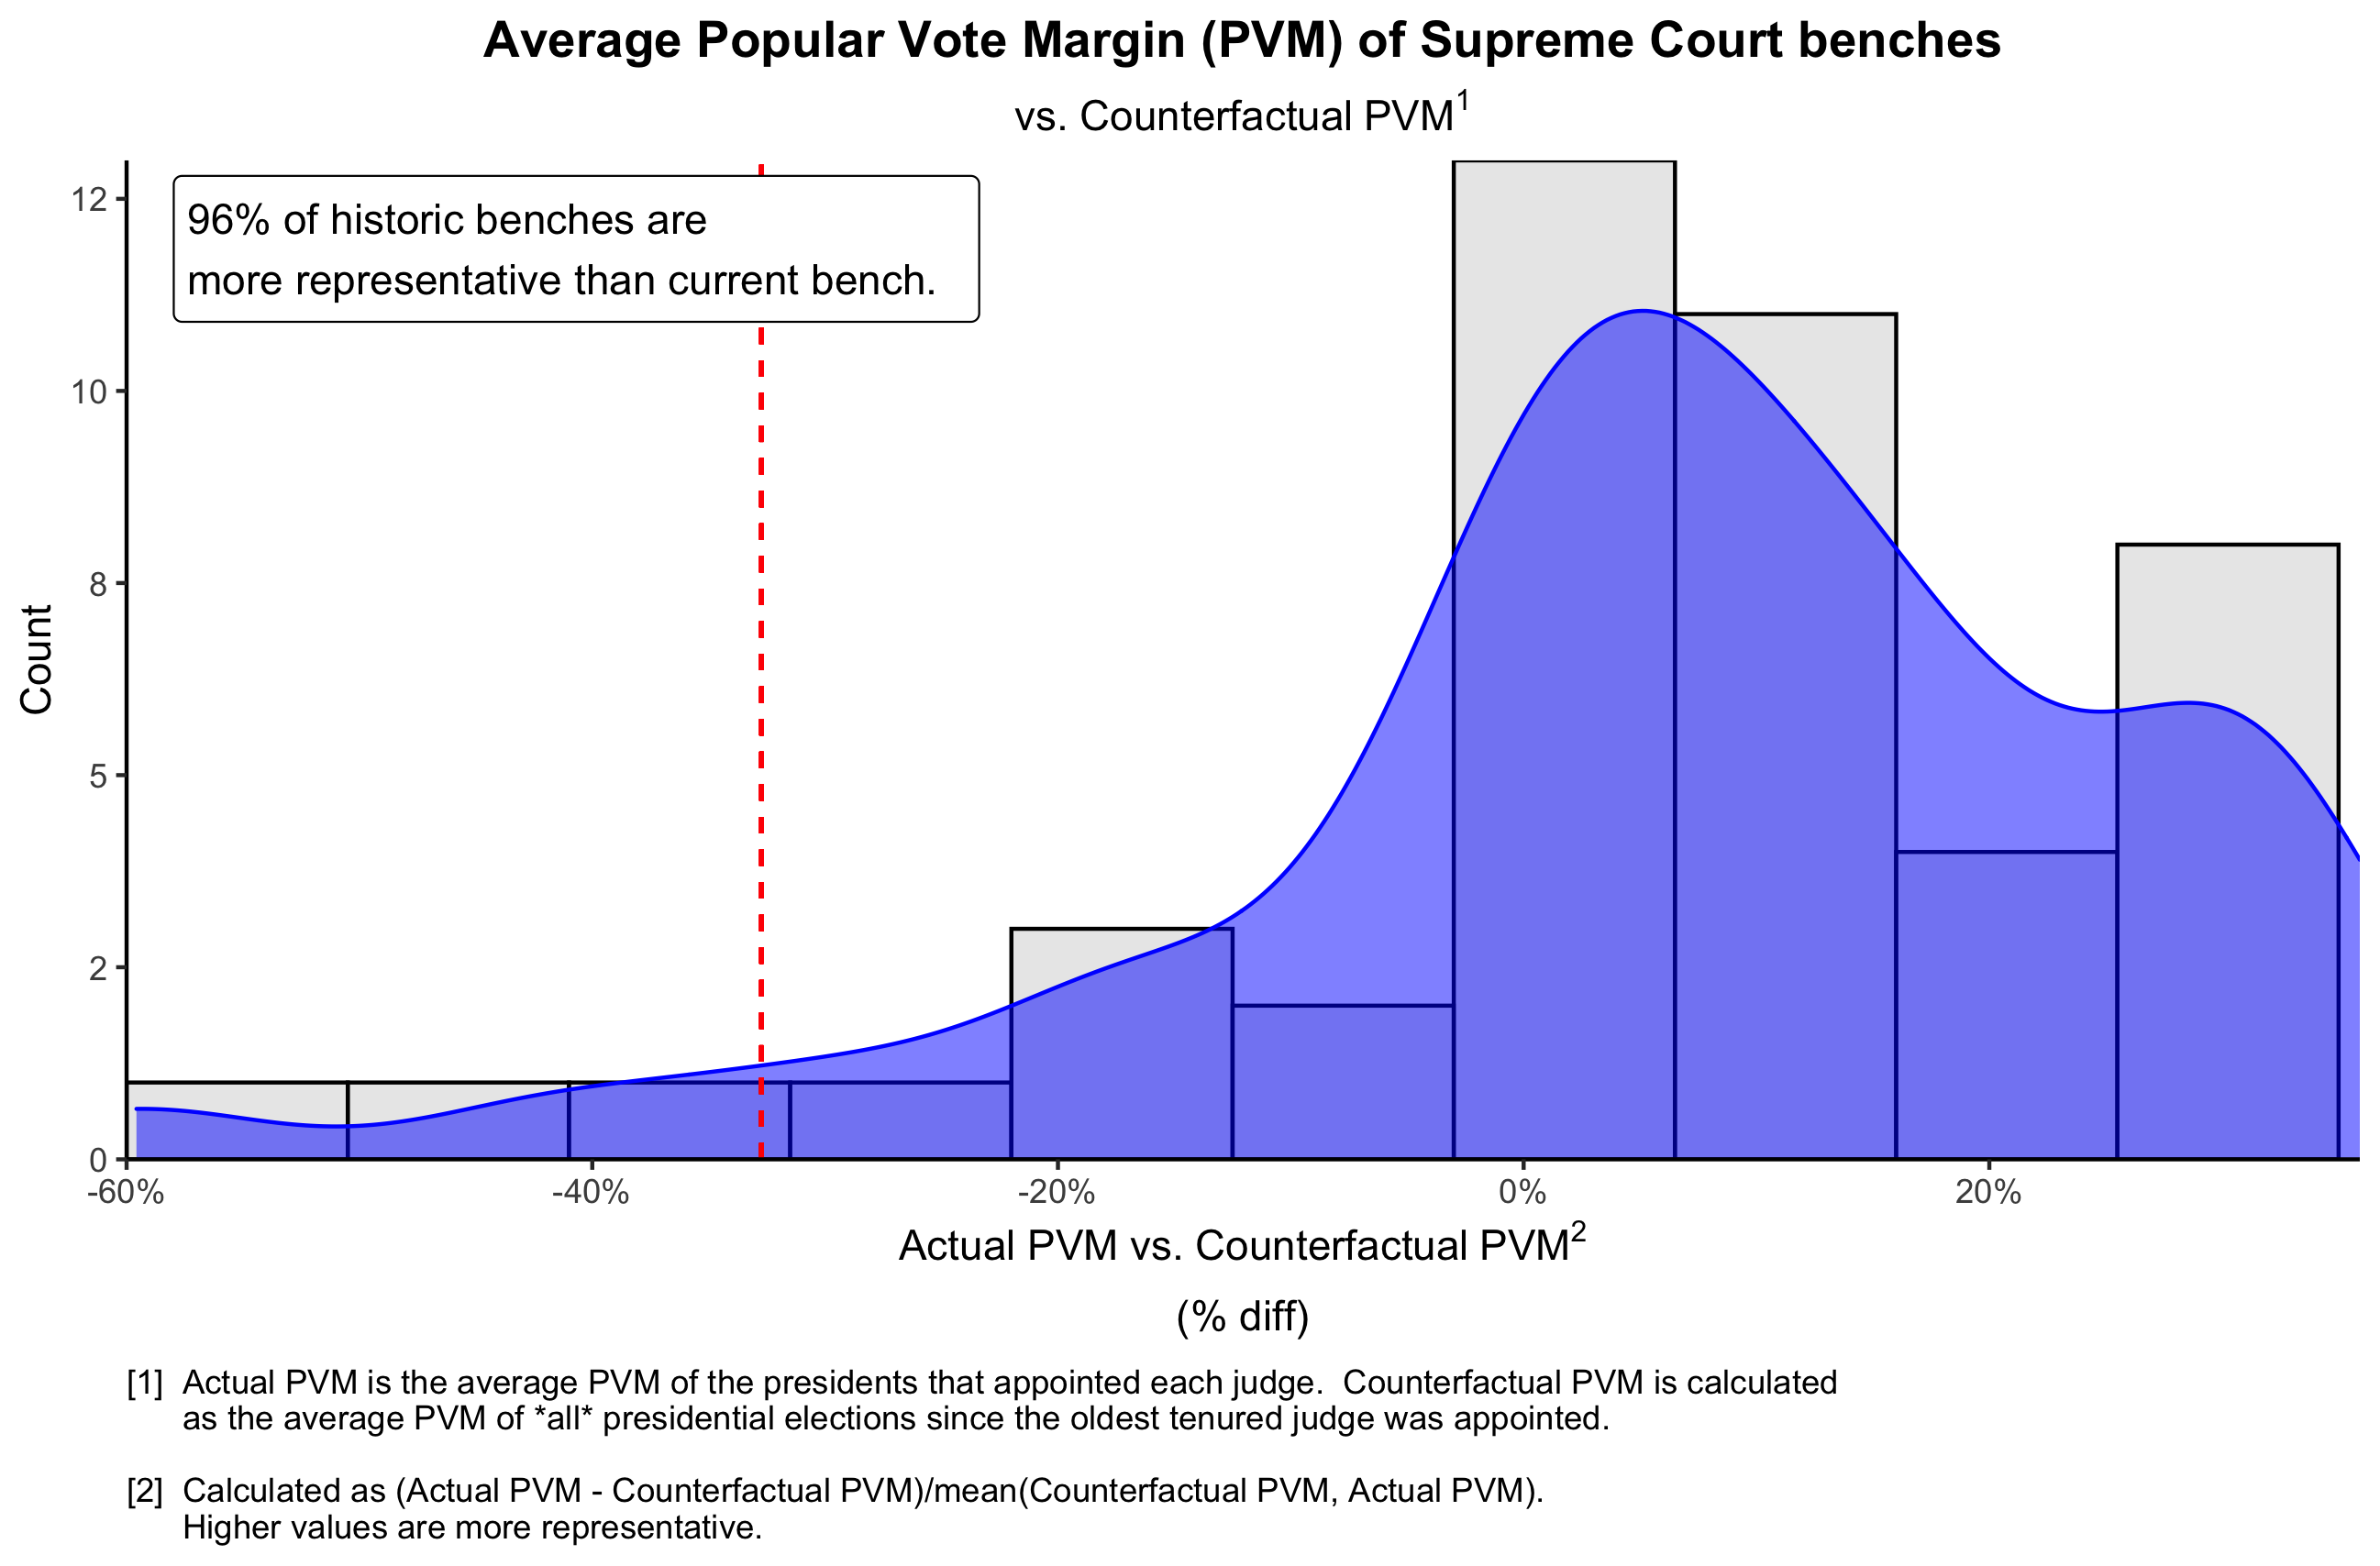
The results of this approach are similar to that of Approach 1. Using this approach, 96% of historical Supreme Court benches are more representative than the current bench.
However, this approach also probably isn’t perfect:
- Looking at average popular vote margins allows presidents that win landslide victories to skew the data. Consider a hypothetical bench where 8/9 justices were appointed by a president that lost the popular vote with a popular vote margin of -0.5%. Yet the last judge was appointed by a president that won the popular vote by 15%. The average popular vote margin of this bench would be 1.2% (the average of -0.5% times 8 and 15%). This suggests a potentially “representative” bench at face value, but the real picture is a lot murkier.
Approach 3: Looking at the % of elections won by each party
A potential way to deal with the problem described above is to look at the % of justices appointed by each party rather than the popular vote margin. We can then compare that to the % of elections won by each party overall in the time period of a particular Supreme Court. Again, this is best explained using an example, so let’s consider again our hypothetical 1996 bench from earlier:
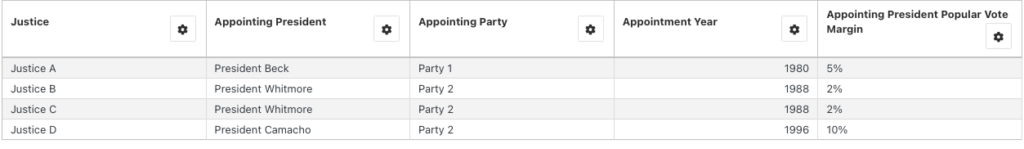
- Here we see that Party 2 (the “dominant” party of this cycle) appointed 75% of of our justices. Now let’s consider all the election results:
- Now we see that of the 5 elections since the oldest tenured judge was appointed, 60% were won by Party 2 (the “dominant” party). This implies that Party 2 appointed 15% more justices than they “should have” if justices were appointed proportionately by parties based on all election results.
For this approach, I take the absolute value of the difference between the two numbers in question for each bench. I do this because a party that won 50% of elections but appointed 75% of judges is equally problematic as a party that won 50% of elections but only appointed 25% of judges. The results of this approach can be seen below:
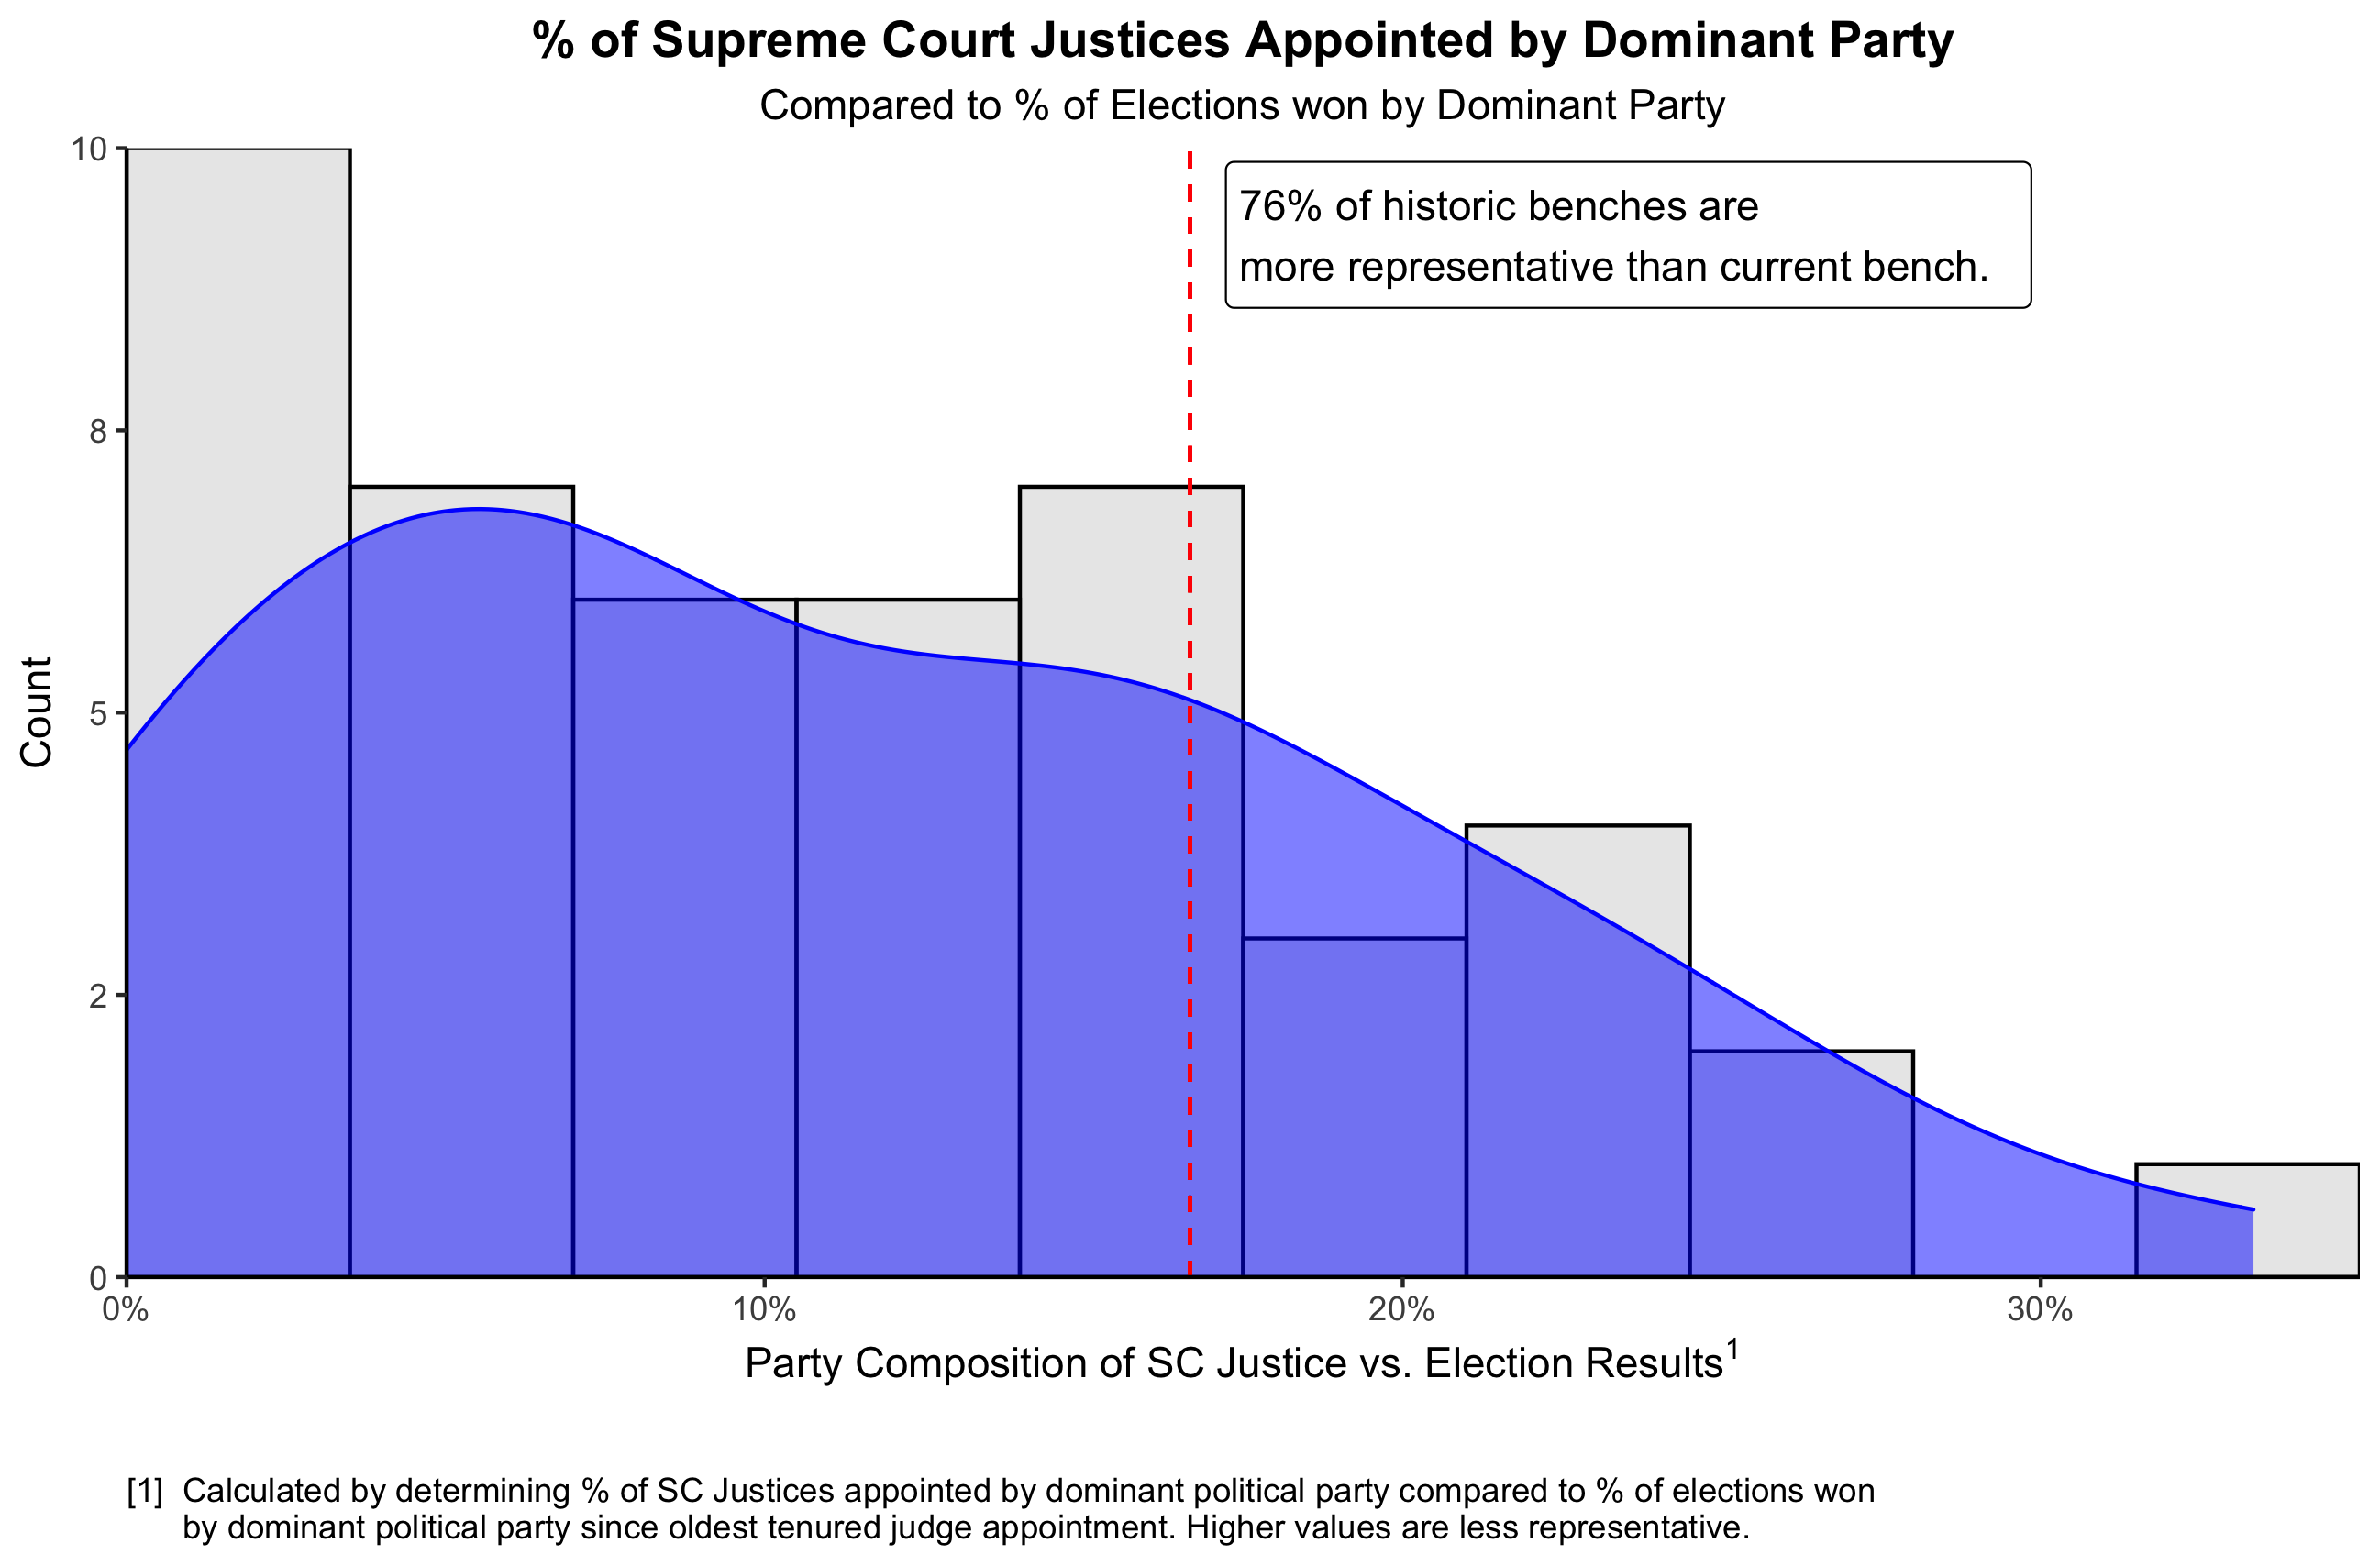
Since the appointment of the current oldest tenured Supreme Court justice (Clarence Thomas; appointed in 1991), Republicans and Democrats have won an equal amount of elections. However, Republicans have appointed 66.7% of Supreme Court justices. This indicates a discrepancy of 16.7 percentage points. As seen above, only 24% of historic Supreme Court benches have a more extreme discrepancy between elections won by the “dominant” party and the number of justices appointed by the “dominant” party.
Final Verdict
We tried to quantify just how “unrepresentative” the current Supreme Court bench is using several approaches. Each approach supports the claims that the current Supreme Court bench is “unrepresentative”:
There is compelling evidence that the current Supreme Court bench is historically unrepresentative of the will of the American voting population.
Silver Linings
It’s not all doom and gloom, though. There are some encouraging things about the current makeup of the Supreme Court bench. With the appointment of Ketanji Brown Jackson, 3 justices are People of Color, and 4 are Women. Overall, that makes 5 out of 9 justices (56%) from a historically marginalized group – far and away the highest it has ever been. No matter your feelings about the current Supreme Court bench, this is a very encouraging trend.
If you liked this article, please Subscribe below! I promise I’ll only email you when new articles are released.